Performance Testing with Grafana K6
Slow websites can frustrate users because they cannot access information instantly. As a result, performance testing plays a critical role in establishing acceptable quality levels, so our goal as software engineers is to catch performance issues before they reach the production environment. While there are many tools available, both paid and open source, this article will focus specifically on Grafana k6.
Grafana k6 is an open-source tool that allows you to test the performance of your applications. Tests are written in JavaScript, which makes them easier to write, read, and maintain. Additionally, k6 offers various extensions to support a wide range of use cases. The code can also be easily integrated into existing CI/CD pipelines, enabling automated performance testing as part of your development workflow.
Contents
Before You Start
Before running any performance tests, it’s important to consider the potential impact and plan accordingly. Here are some key questions to ensure your tests are safe and that proper communication has been done:
- Are my performance testing goals clear? Do I know how many users my system can handle, or at which point it starts to degrade?
- Do I have a strategy for the type of load test to execute? There are many types of load tests. Please refer to this article on the Grafana website to learn more. It’s usually best to start with a smoke test using a small number of users (less than 5) to verify that the script works as expected.
- Are you or your team the owner of the application under test? You should never run K6 tests against random applications.
- Is your application connected to other systems? If yes, are the relevant teams aware of the performance testing initiative and aligned regarding the test execution? Keep in mind that external APIs could be affected by the high number of requests.
- Have you coordinated with your IT/SRE team or hosting provider (if applicable)? Make sure it is safe to run the tests without causing unintended issues or being blocked because of company security policies.
- Do you have a proper environment for testing? Running tests in production is not recommended to avoid impacting users. Ideally, an environment with specifications like production should be used.
After taking the time to assess the impact, consider the questions above, and do the necessary communications and alignments, you can move on to the practical part.
Install k6
k6 does not offer a graphical user interface; however, the installation process is very simple. Especially if you are familiar with package managers. For example, macOS users with Homebrew can install it with just a single command:
brew install k6
For other operational systems, please check the dedicated page on their website regarding the setup process.
Getting Started
After installing K6, you are ready to start writing your tests. To do this, create a JavaScript file. For instance, a folder named tests or scripts can be created to better organize the test scripts.
Example 1
This example demonstrates a very simple test. It imports the http module to make requests and the sleep function to pause execution. Next, it defines an options block, where the number of virtual users (VUs) and the test duration are configured. If needed, the number of iterations can also be defined in this block. These options can alternatively be set at execution time via the command line.
The script then sends a GET request to a specific URL and waits one second before continuing.
import http from "k6/http";
import { sleep } from "k6";

export const options = {
  vus: 5,
  duration: "10s",
};

export default function () {
  http.get("https://quickpizza.grafana.com/test.k6.io/");
  sleep(1);
}
First Test – View code on GitHub Gist
To run the test, execute:
k6 run FILENAME.js
If everything runs successfully, you should see an output like the screenshot below.
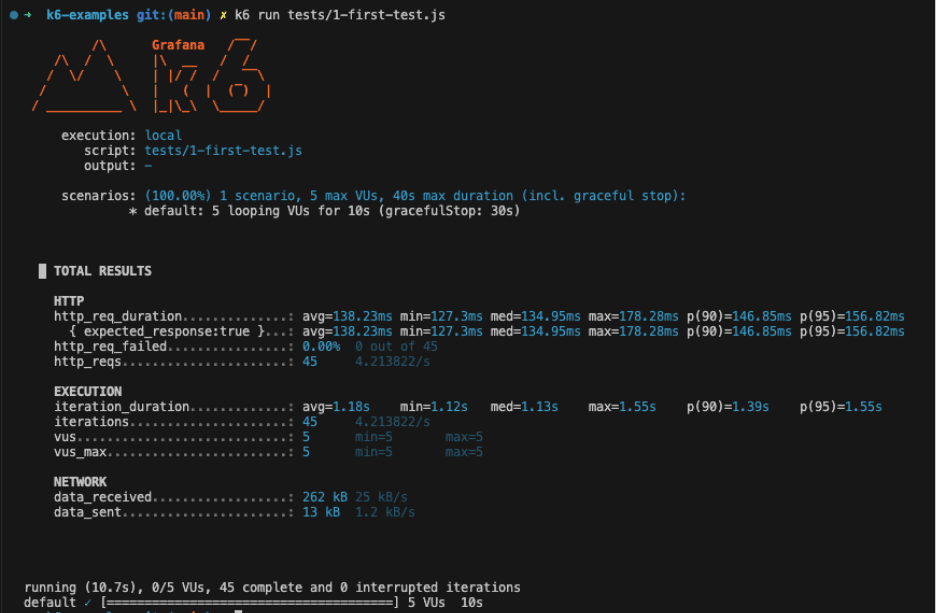
Notice that the defined number of VUs and duration were applied. In our case, the script ran for 10 seconds with 5 users simultaneously calling the specified URL.
From the output, you can observe that:
- 45 requests were made (
http_reqs). - None of them failed (
http_req_failed). - The average request duration (
http_req_duration) was 138.23ms. - Considering 90% of the requests, the duration was 146.85ms (
p(90)) or less.
Those are some of the built-in metrics included in the default K6 summary report, but you can also create custom metrics.
It’s important to highlight that when analyzing performance results, percentiles are more meaningful metrics than minimum (min) and maximum (max). The minimum and maximum can represent outliers, while percentiles show how the system behaves for most requests.
Example 2
This example builds on the previous one but introduces new concepts: Checks, Assertions, and Thresholds.
Checks are like assertions, a concept you are probably already familiar with. They are used to validate whether the application under test behaves as expected. To use them, you need to import the check function from the k6 library.
For example, a check can verify that the response status code is 200 or that the response body contains a specific text:
import http from "k6/http";
import { sleep, check } from "k6";

export const options = {
  vus: 5,
  duration: "10s",
};

export default function () {
  const response = http.get("https://quickpizza.grafana.com/test.k6.io/");

  check(response, {
    "is status 200": (res) => res.status === 200,
    "response body contains text": (res) => res.body.includes("QuickPizza page"),
  });

  sleep(1);
}
Example using Checks – View code on GitHub Gist
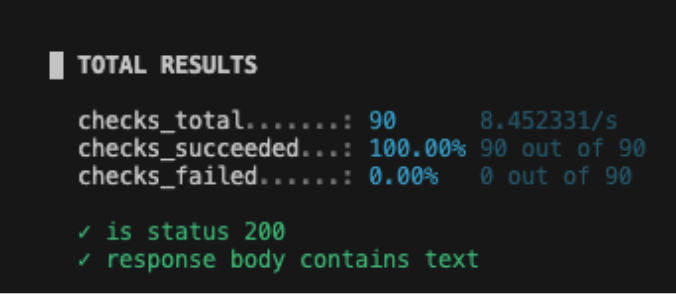
When executing this test, you will notice a new section in the output dedicated to checks. It shows the total number of checks executed, as well as how many passed and failed. It is important to mention that a failed check does not interrupt the test execution, nor does it cause the test to return a failed exit status.
Assertions can also be used to validate that your application behaves as expected during the testing; however, they immediately fail and interrupt the test execution when expectations are not met. In order to use it, you need to import the expect function and define an assertion passing a value to the expect function.
It is also important to mention that, at the time of writing this article, assertions are a preview feature in K6, and some functionality may still be missing.
As can be noted on the example below, the assertions API is inspired by Playwright’s assertion syntax, and they are easy to read and understand.
import { expect } from "https://jslib.k6.io/k6-testing/0.6.1/index.js";
import http from "k6/http";
import { sleep } from "k6";

export const options = {
  vus: 5,
  duration: "10s",
};

export default function () {
  const response = http.get("https://quickpizza.grafana.com/test.k6.io/");

  expect(response.status).toBe(200);
  sleep(1);
}
Example using Assertions – View code on GitHub Gist
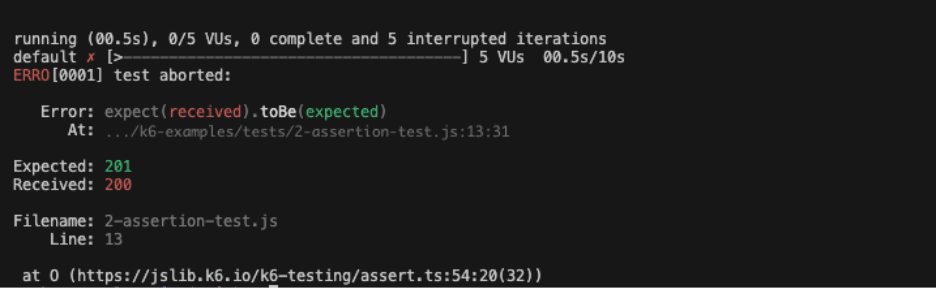
As mentioned earlier, if an assertion fails, the test is immediately aborted. In the screenshot below, you can see that 0 iterations were completed because the assertion was deliberately set to fail. If all assertions pass, there is no change in the output. Unlike checks, assertions do not collect metrics, so the output does not include a dedicated section for them.
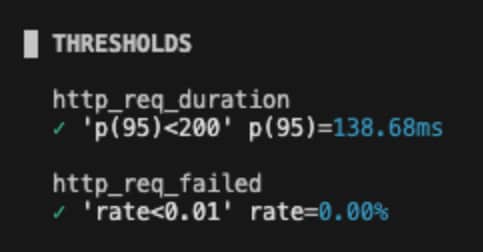
Thresholds are commonly used in performance contexts to define the expectations for the applications, and on k6, it’s a way to pass or fail the test based on the conditions. The thresholds are defined in the options block, and you can add more than one, like the example below.
import http from "k6/http";
import { sleep } from "k6";

export const options = {
  vus: 5,
  duration: "10s",
  thresholds: {
    http_req_failed: ["rate<0.01"],
    http_req_duration: ["p(95)<200"],
  },
};

export default function () {
  http.get("https://quickpizza.grafana.com/test.k6.io/");
  sleep(1);
}
Example using thresholds – View code on GitHub Gist
The example has 2 thresholds. One to evaluate that less than 1% of the requests return an error and the second one to check that 95% of the requests have a response time below 200ms. Similar to the checks, there is also a dedicated section on the output.
Integrating with CI/CD
To run tests continuously and automatically, you can integrate K6 test execution into your CI/CD pipeline.
For GitHub Actions, K6 provides official actions that simplify the setup, making the workflow file very straightforward, as shown in the example below. It’s important to update the path to your test files; otherwise, they will not be found during execution.
name: Run Grafana K6 Loading Tests

on:
  push:
    branches:
      - main

jobs:
  run-tests:
    runs-on: ubuntu-latest
    steps:
      - name: Checkout repository
        uses: actions/checkout@v4

      - name: Setup k6
        uses: grafana/setup-k6-action@v1

      - name: Run k6 tests
        uses: grafana/run-k6-action@v1
        with:
          path: |
            ./tests/*test.js
            ./tests/*script.js
GitHub Actions workflow – View code on GitHub Gist
Like the official actions available in the GitHub Actions Marketplace, there is also an extension for Azure Pipelines. This option requires installing the extension in your Azure DevOps organization, but once installed, the setup process is straightforward. Please refer to this article for more details.
For Jenkins, there is also an article that explains how to create the Jenkinsfile and run the tests.
Conclusion
Like any tool, K6 has some limitations, for example, it does not connect directly to the server, so it cannot provide metrics such as memory or CPU usage. However, it does offer other metrics that are equally important for your project.
In one of our projects, K6 was integrated into the pipelines and runs after each deployment. This allows the team to automatically verify that no performance issues were introduced. For example, if a specific test fails, they know that in this specific version something went wrong, causing the assertions or thresholds to fail.
Additionally, the official documentation and articles available on the website are clear, well-structured, and very detailed. The community has also done a great job; you can easily find a post or even a video that addresses your needs.
Related articles

Manuella Filet
The Collaborative Machinery Behind Support
Support work is often imagined as something happening in the background, like a steady hum ensuring everything keeps running.
Mar 17, 2026

Pedro Oliveira da Silva
Test, Experiment, Delight: Reflections from the Digitale Leute Summit
For Pedro Oliveira da Silva, the 2025 edition of the Digitale Leute Summit marked his return after first attending the event in 2024, a year that had already exceeded his expectations with strong speakers, hands-on sessions, and meaningful opportunities to connect with professionals in software product development. Having the summit hosted once again in his city of Cologne made it easy to immerse himself fully in the experience.
Mar 10, 2026

Cláudio Medina, Moritz Blum, +1
How IA and Architecture Meet: What 'AI by Design' Requires From Information Structure
On March 7th, we mark World Information Architecture Day, a global moment dedicated to how information is structured, connected, and made meaningful.
Mar 7, 2026